
오답노트
[matplotlib] 여러 그래프 나누어 그리기 본문
sublpot
plt.subplot(row, col, index)
- row : 세로로 생성할 차트 개수
- col : 가로로 생성할 차트 개수
- index : 차트의 위치 (1부터 시작)
subplot은 여러 차트를 한번에 출력할 수 있다.
plot 함수를 사용하기 전에 먼저 호출하여 사용해야한다.
다음 subplot을 만나기전까지 plot에 plt 함수가 적용된다.
lst1 = list(range(1,6))
lst2 = list(range(2,7))
lst3 = list(range(11,16))
lst4 = list(range(12,17))
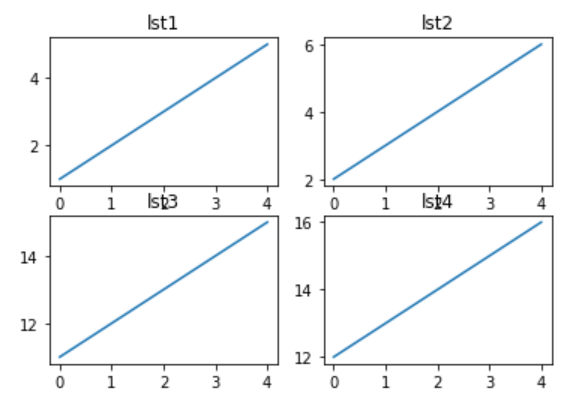
plt.subplot(2,2,1)
plt.plot(lst1)
plt.title("lst1")
plt.subplot(2,2,2)
plt.plot(lst2)
plt.title("lst2")
plt.subplot(2,2,3)
plt.plot(lst3)
plt.title("lst3")
plt.subplot(2,2,4)
plt.plot(lst4)
plt.title("lst4")
plt.show()
tight_layout
사진1.1을 보면 타이틀이 x축과 겹치는 현상이 나타난다.
이 때 tight_layout 함수를 사용하면 보기 좋게 적절히 차트들이 이동하거나 크기가 조절된다.
lst1 = list(range(1,6))
lst2 = list(range(2,7))
lst3 = list(range(11,16))
lst4 = list(range(12,17))

plt.subplot(2,2,1)
plt.plot(lst1)
plt.title("lst1")

plt.subplot(2,2,2)
plt.plot(lst2)
plt.title("lst2")

plt.subplot(2,2,3)
plt.plot(lst3)
plt.title("lst3")

plt.subplot(2,2,4)
plt.plot(lst4)
plt.title("lst4")

######
plt.tight_layout()
######

plt.show()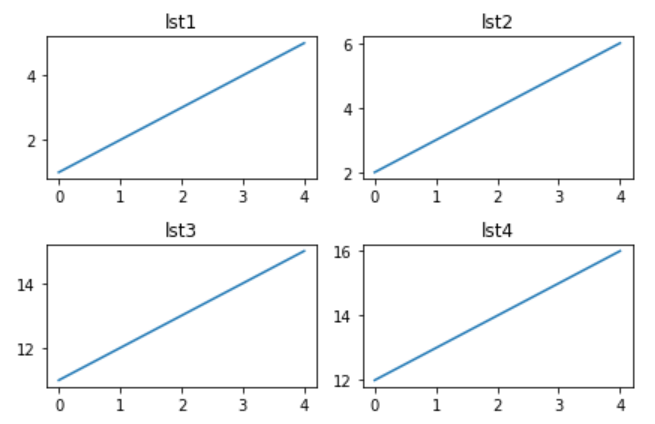
'Python > Matplotlib' 카테고리의 다른 글
| [matplotlib] scatter (산점도) (0) | 2022.08.11 |
|---|---|
| [matplotlib] 범주형 데이터 시각화 (0) | 2022.08.11 |
| [matplotlib] 수치형 데이터 시각화 (0) | 2022.08.10 |
| [matplotlib] 차트 조정과 그리기 (0) | 2022.08.10 |
| [matplotlib] matplotlib와 차트 그리기 (0) | 2022.08.10 |
'Python/Matplotlib' Related Articles
more


